Why is Australia getting skunked this winter?
A technical analysis into where Australia's winter ski season went in 2023
It’s hard to escape the doom and gloom of media reports slagging off Australia’s 2023 ski season. Even after a few good ones over the last 3-4 years, is it really that bad?
One way we can measure it is via peak depth at Spencers Creek. Whilst it’s becoming increasingly neglected by Snowy Hydro, it’s still a longstanding, clean dataset.
In summary, we’re seeing potentially* the shallowest snowpack in the last 10+ years. And the earliest snow pack peak since 2011 (165cm on 28th July 2011).
*Considering we may have already reached our snowpack peak.
Another way we might be able to gauge the season is to compare satellite images for spatial distribution. Here’s how our ‘potential‘ peak snow depth in 2023 (131cm) is stacked up against 2017’s 196cm in September. Remembering 2017 was the deepest snowpack Spencers Creek had seen since 2004.
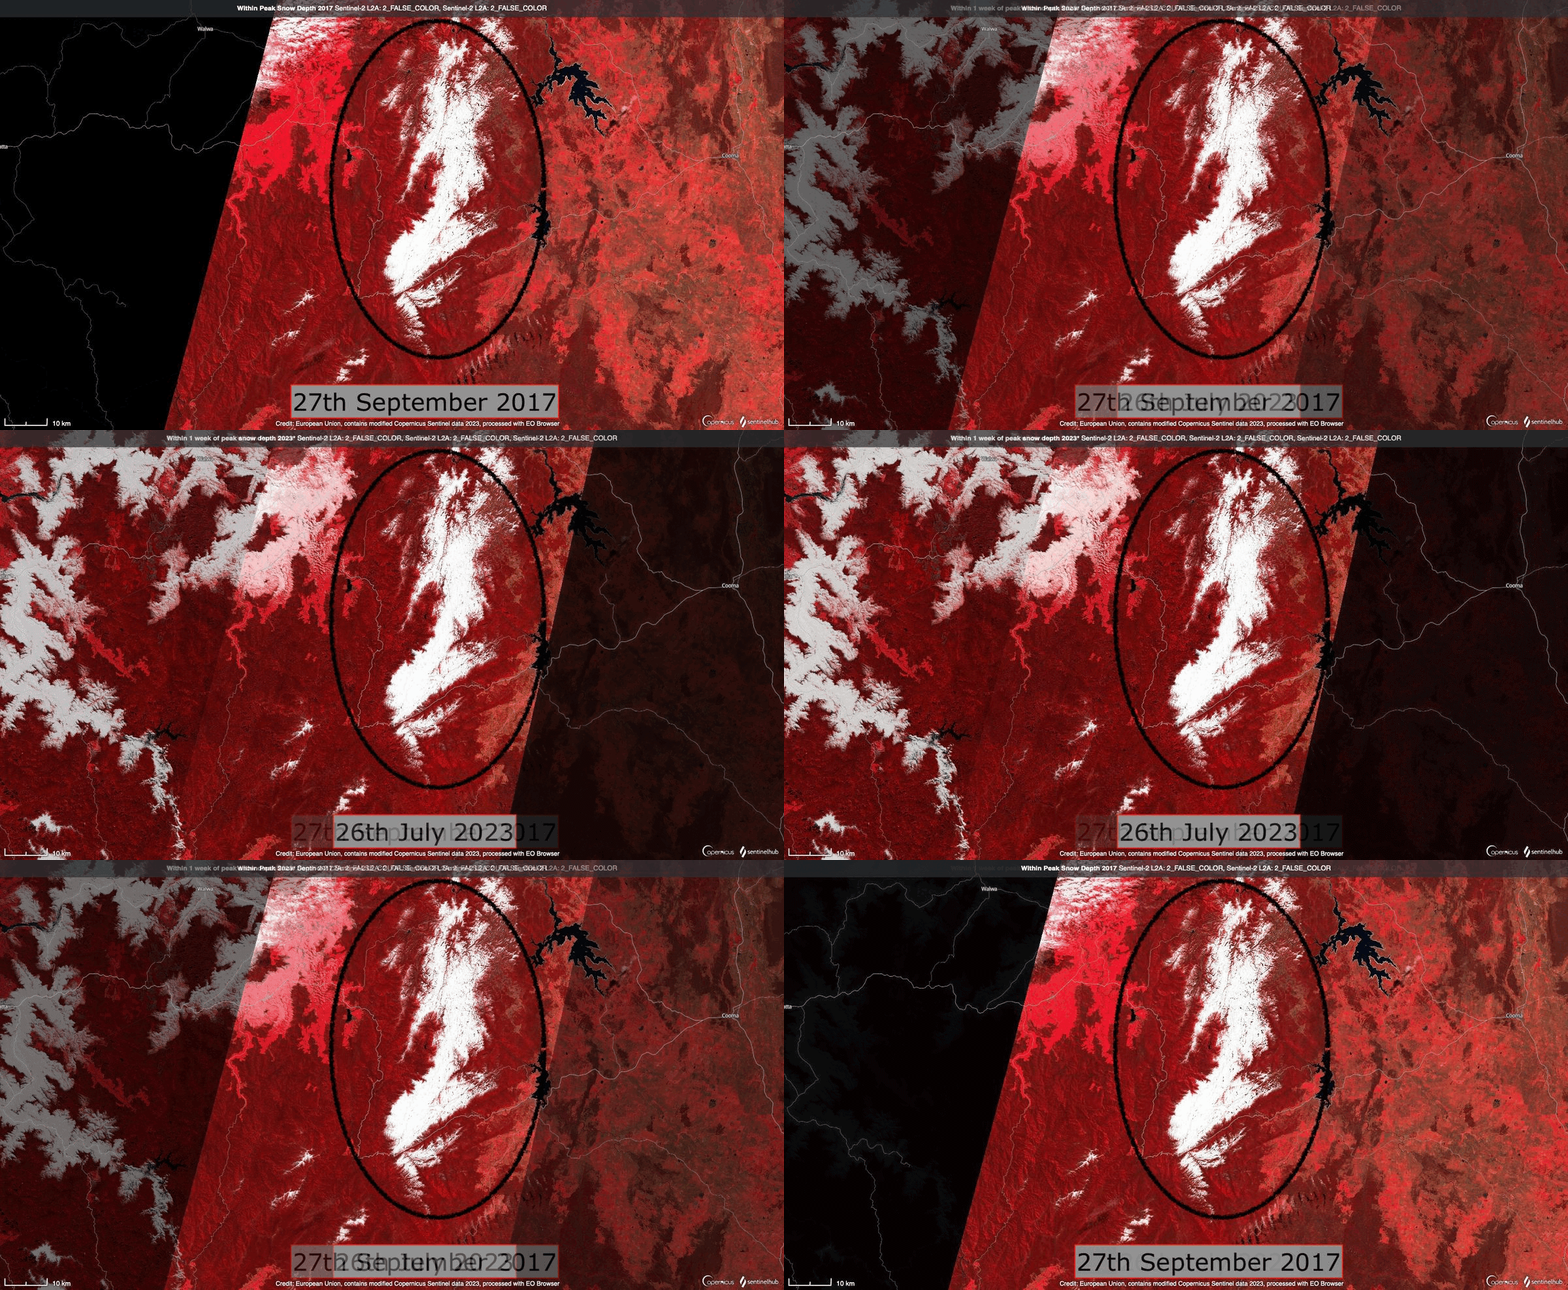
Seemingly, 2023 has done pretty well in terms of the snow coverage extent. Obviously, this doesn't factor in the coverage of vegetation and rocks that you’re likely to see at ground level.
So where has it gone all wrong?
To understand the ‘why’, let’s first look at broadscale (global) influences.
We have a developing El Nino in the Pacific, with most international agencies declaring El Nino as being ‘currently underway’. Whilst in the Indian Ocean we have a positive Indian Ocean Dipole.
It’s worth pointing out that in the Western Pacific (NE of Australia) we still have warm sea surface temperatures (residual of the former La Nina phase) which continues to support deep convective development and good typhoon productivity in the Western Pac.
These large regions of deep convection in the tropics contribute to how the polar circulation performs and amplifies long wave nodes.
The best way to visualise this deep convective activity is via the upper-level Velocity Potential (VP). The VP is indicative of horizontal winds at jetstream levels. Thus, at some 12 km up, divergent winds indicate strong upper-level outflow from storm activity, while converging winds suggest subsidence or descending air. Respectively, these translate to regions of low pressure, and regions of generally clear weather, with high pressure at the surface.
Looking at the VP plot above we can see good tropical storm productivity through the Pacific and into the Atlantic, with the former largely driven by the strong positive SSTs in the Pac (El Nino).
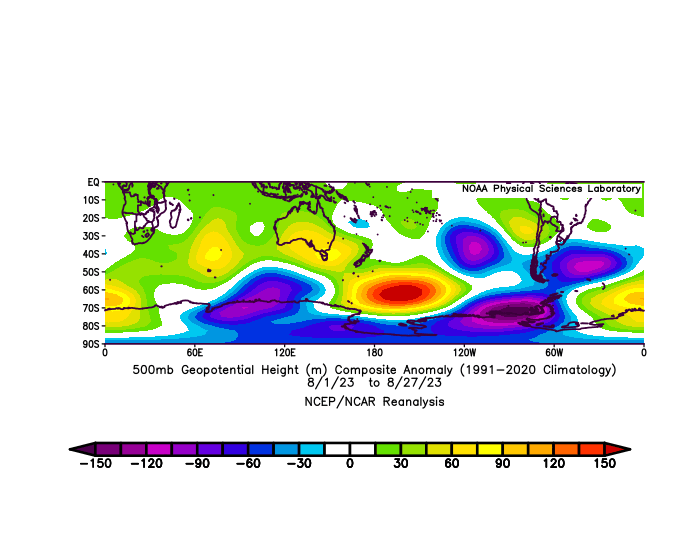
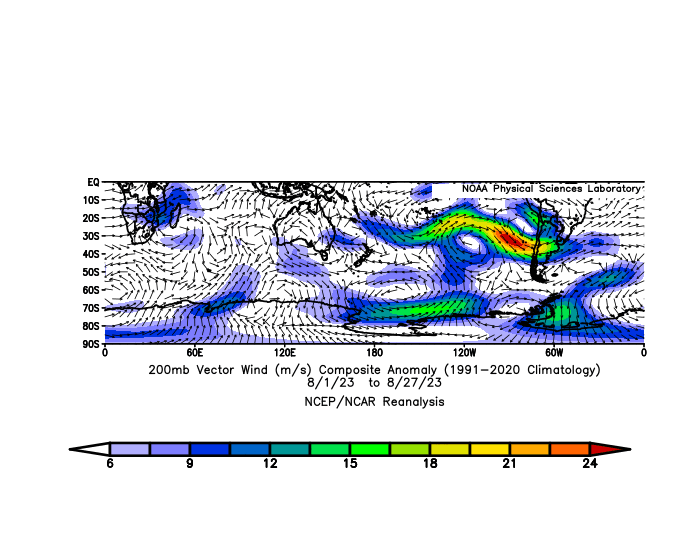
Deep convection along the equator drives Rossby Waves - large planetary waves that propagate through equatorial regions, deviating the polar storm track. In summary, these large regions of deep convection in the tropics contribute to how the polar circulation performs and amplifies the polar long-wave activity. This polar amplification is suggested by black arrows along the above plot.
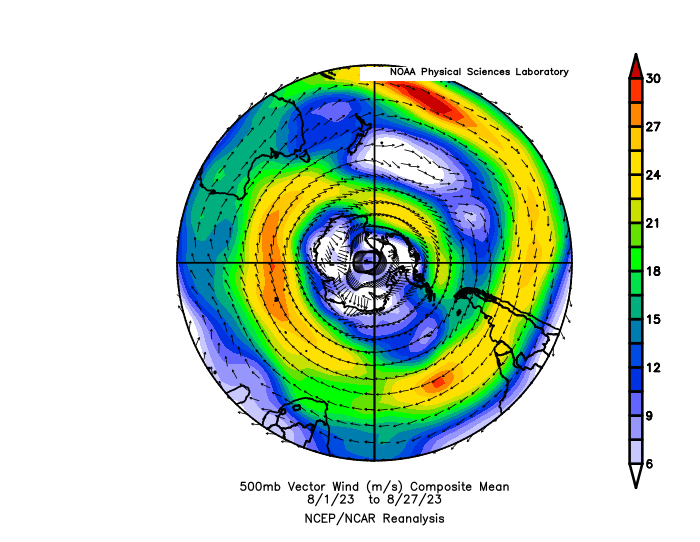
This setup has resulted in an abnormal abundance of frontal activity hitting South America, leaving Chilean & Patagonian resorts with 1-3m of snow last week, and more metres on on the way.
So, although we have a somewhat favourable bias of a neutral-negative Southern Annular Mode (SAM) phase at the moment, you can see that all the action is concentrated over the Western hemisphere (Pac & Atlantic). In simple terms, if we think of the circumpolar storm track as an elastic band, with all the tropical activity in the Pacific pulling that elastic band toward the western hemisphere it offers very little ‘slack’ for the frontal systems to meander northwards in our region. Hence this is why we’re seeing most of the winter storms sneak south below Australia.
Keep reading with a 7-day free trial
Subscribe to The Snowstack to keep reading this post and get 7 days of free access to the full post archives.


