Negative SAM Paying Dividends
Winter storm track expands northwards, Southern Australia to benefit
Tropical weather amplifying the polar jet over southern Aus
15-30mm of rain in the alpine on Tuesday/Wednesday
Cold front to deliver 20-30cm snow Thursday/Friday
Follow-up cold front to deliver additional 35-45cm by Sunday morning
Southern Annular Mode rapidly plunged to -2.1 on Friday (NOAA)
With ENSO gearing up for an imminent El Nino phase we start to see the Southern Annular Mode (SAM, also known as AAO) favour a negative bias on a seasonal scale. This is typically great for winter snow systems as it means our winter storm track moves northward offering the Aussie alpine region access to more winter fronts. The example below highlights the brief inactivity of fronts for Southern Aus last week, dominated by a ridge and a renewed offering in the week ahead:

Driven by planetary waves, the negative SAM phase is characterised by large peaks (known as ‘nodes’) and troughs, I’ve highlighted these nodes via the black arrows in the above comparison. These nodes can impact midlatitude regions for 4-7 days, and possibly longer where the nodes merge.
SAM/AAO is forecasted to remain in the -1 to -2 range of the index over the next week, maintaining its ‘nodal’ organisation. As ENSO settles into a more confirmed state (El Nino) we will start to see these SAM phases protract over weeks with less volatility and variability. It’s worth also noting that a negative SAM phase in summer influences a contrasting outlook.

The June Recap
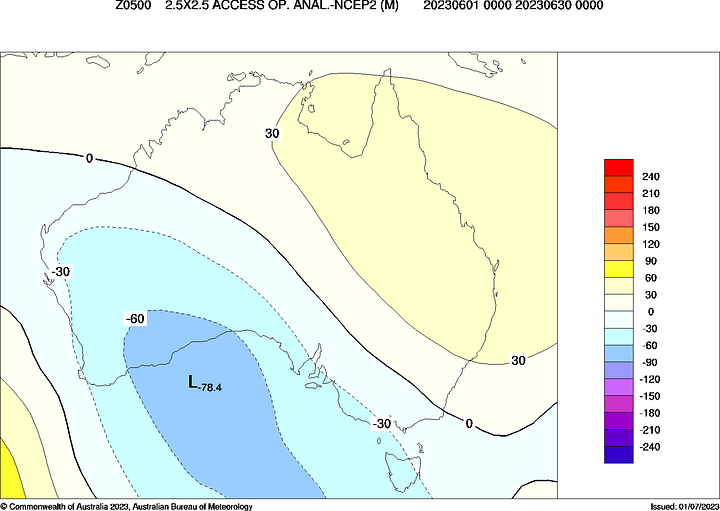
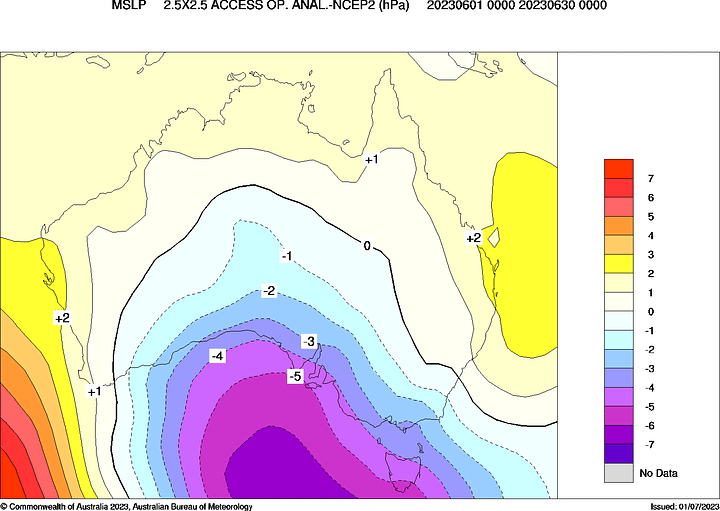
A negative SAM phase for much of June resulted in a sustained long-wave nodal pattern peaking in the Australian Bight last month (figure below), which has delivered an above-average June snowpack.


So what’s been driving these anomalies in our region?
For us to understand the nuances of midlattidue flow we must consider how the tropics and polar vortex are performing.
I won’t bore you with it too much in this edition however to summarise; broadscale tropical convection is influenced by planetary wave patterns, ENSO, the MJO and Sea Surface Temperatures (SSTs). All of these have lateral (5S, 5°N along the equator) teleconnections. As they transition and interact, they push and pull the polar storm track in both hemispheres.
The observed tropical influence over the past month can be viewed in the left hand pannels of the following diagram (for those with a keen eye will notice a big anomaly built in the forecast mid-July on the right):
From the 11-24th June there were numerous influences in our tropical region with some influence sneaking into the midlattitudes in the final week of June presenting in the form of those NW cloud bands.
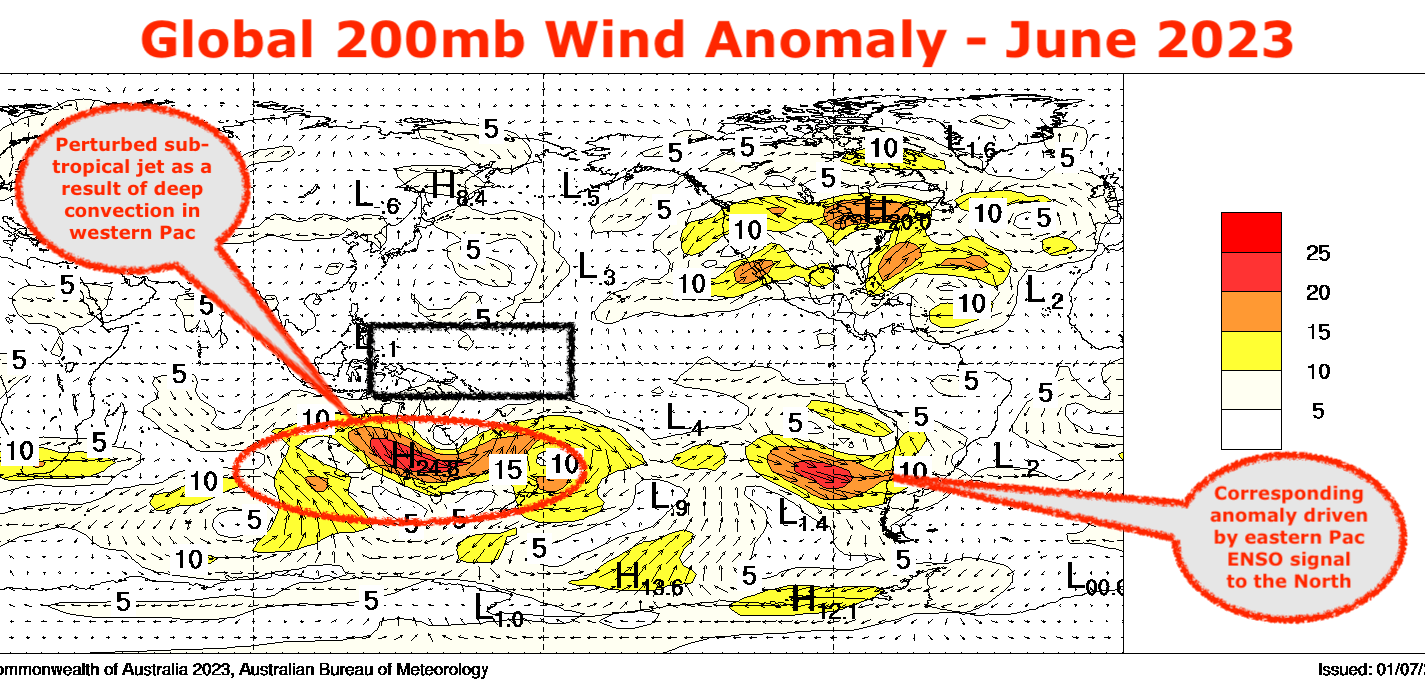
We know that the SSTs are kicking off in the eastern Pacific as we see the start of the El Nino signal, however we still have the remannts of the La Nina phase in the Western Pac (warm anomalies over Asia) this has played out in the form of a sustained tropical low signal (purple trace) in the Western Pac. Thus, presenting as a perturbation of the polar storm track and subtropical jet to it’s south.
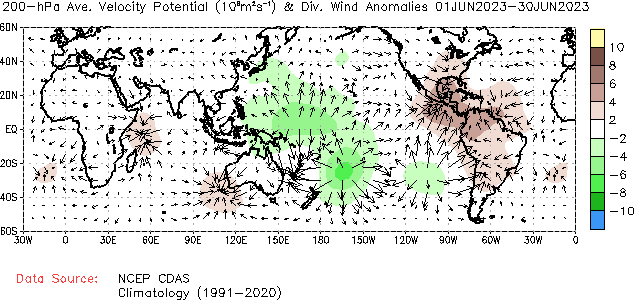
Below is the 200mb divergent wind anomalies & precip highlighting enhanced tropical convection in Western Pac of last month. This is in the upper troposphere so this green highlights convergence (storms) in the lower atmosphere and divergence (storm outflow) in the upper trop. In short, deep convecting storms are characterised by the green shading, brown is regions of high pressure ridging and stable weather.


So now that we have the tropics out of the way, how’s the Polar Vortex tracking?
In short, the polar vortex (PV) has been humming along to near climatological mean, both in temporal scale and flow despite suffering a slow start out of the gates in May.
Via NOAA, the coldest air of the PV is abnormally larger indicating that we may see a reduction of Ozone concentration as we enter our Summer months, however presents very little impact to weather systems for the forseeable.
In my last post I noted the possibly of wave forcing influence in the long range, this has since been scaled back and remains to be seen whether it will eventuate with much gusto as this point. I speculate this forcing is likely a result of the anomalous tropical influence outlined above but we’d need further analysis to confirm this.
Here’s the latest GFS stratospheric wave analysis/forecast on that long range anomaly, you can spot it around mid-July (no surprise that it presents around the same time as that tropical anomaly mentioned above):
In summary, the combination of deep tropical convection, rossby wave transition and a healthy polar vortex have all contributed to the negative SAM phase, causing midlatitude regions to be influenced by both tropical and polar variability. It just so happens the residual La Nina signal has favoured Southern Aus to be influenced by the latter in June (and likely July).
The Short Term Outlook
Moisture from the NW cloud band will impact the alpine region on Tuesday and into Wednesday.
Keep reading with a 7-day free trial
Subscribe to The Snowstack to keep reading this post and get 7 days of free access to the full post archives.


